Land & Ecology · Climate record
Climate &
Weather
Weather writes directly on the desert.
Boulder Gardens sits in the high desert of the Mojave, where long dry periods are interrupted by winter Pacific storms, summer monsoon moisture, strong winds, heat, cold, and occasional bursts of rain. Keeping a climate record helps connect those events to runoff, plants, wildlife, soil, and the sanctuary’s water systems.
Regional reference
A dry place, measured over time
The closest long historical reference used here is the Joshua Tree climate station. Boulder Gardens has its own elevation and microclimate, so these figures are context—not a claim that conditions are identical at the sanctuary.
Historical rainfall
Rainfall through the year
The high desert receives little rain overall, but it does not arrive evenly. Winter storms provide much of the annual total, while summer monsoon and tropical moisture can produce short, highly localized downpours.
Less rain makes every storm legible.
Notable weather event · September 6, 2026
A September rain larger than the monthly average
A nearby Pioneertown station recorded 0.44 inches of precipitation on September 6. That is more than the Joshua Tree station’s historical 0.35-inch average for the entire month of September.
The same Pioneertown station recorded a high of 85°F, a low of 70°F, and a maximum wind speed of 13 mph. Desert rainfall can vary dramatically over short distances, so the 0.44-inch figure should be read as a nearby gauge observation rather than an exact Boulder Gardens total.
Nearby gauge
0.44"
September 6, 2026
≈ 126% of the historical September monthly average
Notable weather event · October 10, 2026
A long October rain
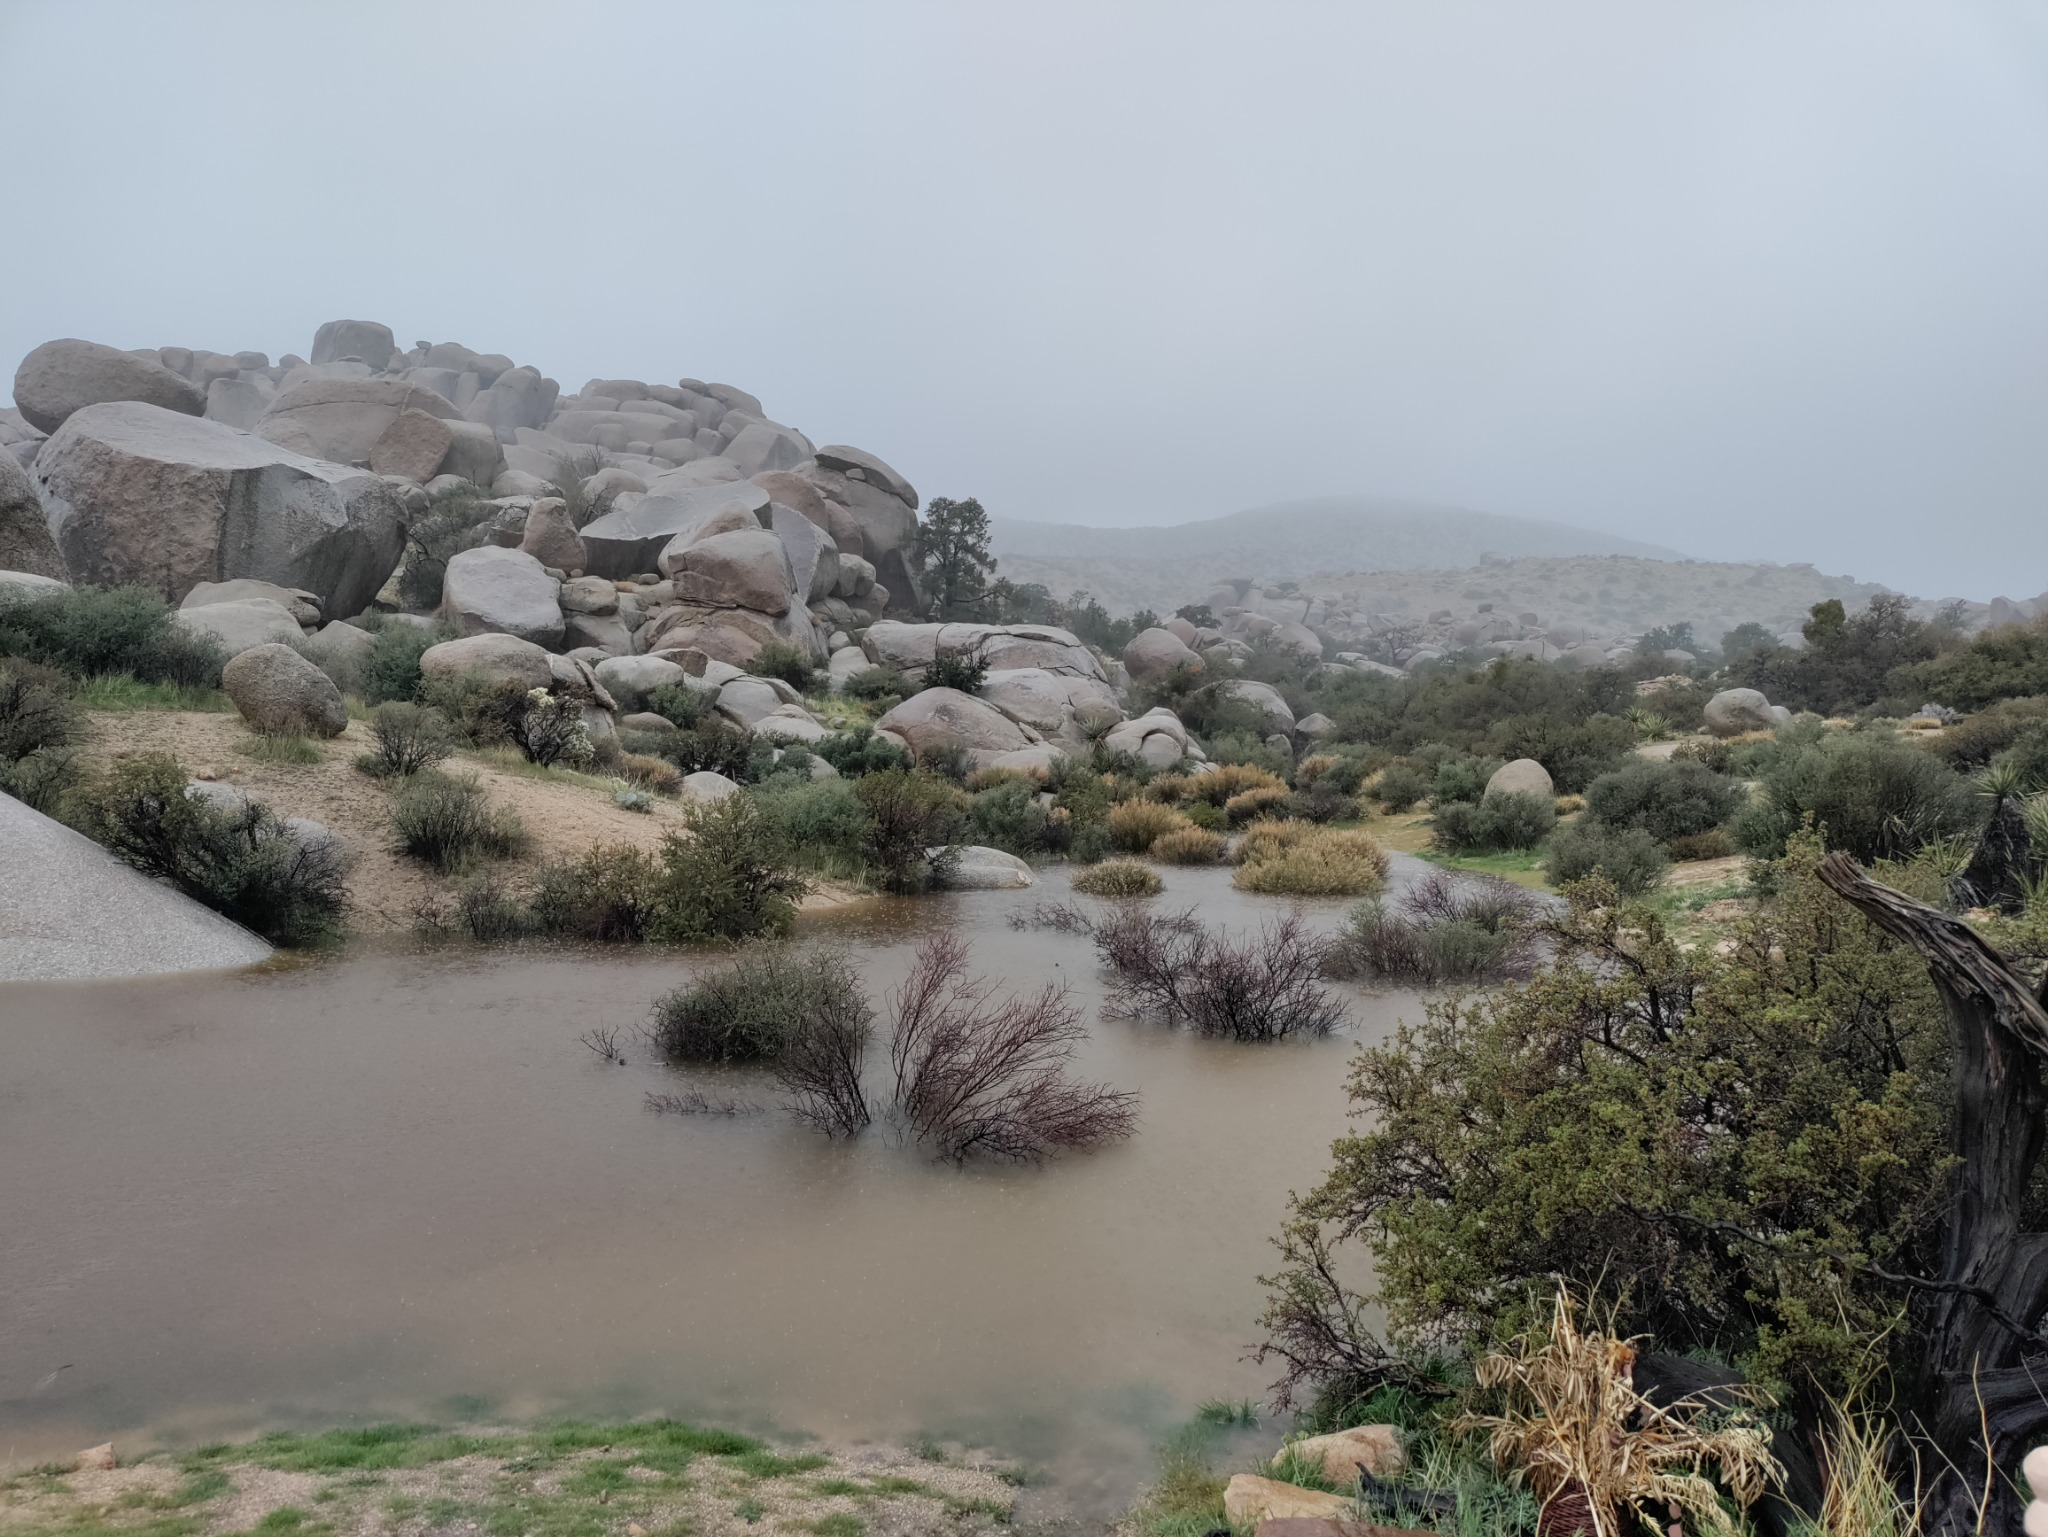
Boulder Gardens received an estimated about 2 inches of rain during a sustained event lasting roughly 8–10 hours. The rain was associated with Tropical Storm Rachel as its moisture moved through Southern California and the Southwest.
Strong winds had been expected locally but did not become the main story. Instead, the sanctuary experienced prolonged rain followed by a sharp cool-down: daytime temperatures fell into the 50s, with nights in the low 40s on October 12–13.
Read Field Report 024 →
Local field estimate
≈ 2"
October 10, 2026
About 8–10 hours of sustained rain
Seasonal patterns
Weather that shapes the sanctuary
Monsoon & tropical moisture
Thunderstorms can be brief, intense, and extraordinarily local. A storm may soak one ridge or wash while leaving another nearly dry.
Pacific storms
Winter systems provide an important share of the region’s rainfall and can bring prolonged cloud cover, colder temperatures, and occasional dramatic runoff.
Wind, heat & cold
Rain is only part of the climate story. Wind, temperature swings, evaporation, frost, and extreme heat all shape how water and life persist here.
Ecology in motion
What happens after rain
A desert storm is not just weather. It becomes hydrology, plant response, animal activity, erosion, storage, and eventually another layer in the field record.
Ephemeral water
Runoff moves quickly through rock basins, washes, paths, and low places. Temporary pools make the shape of the watershed visible.
Plants respond
Even modest rainfall can change soil moisture and trigger new growth, flowering, germination, or recovery after heat stress.
Wildlife follows
Water and plant growth create short-lived opportunities for insects, birds, reptiles, mammals, and other desert life.
Fieldstation notes
Building a local climate record
The regional station record provides historical context. The Fieldstation’s longer-term goal is more local: pair weather events with photographs, sensor measurements, water-system observations, and ecological notes from Boulder Gardens itself.
- Record notable rain, wind, heat, cold, and storm events.
- Document runoff and water-harvesting behavior across the property.
- Pair repeat photography with seasonal observations.
- Preserve local measurements as a durable long-term archive.
Sources & method
Regional context, clearly labeled
Historical precipitation: Western Regional Climate Center, Joshua Tree station, period of record 1959–2010. Monthly averages: Jan 0.69, Feb 0.48, Mar 0.42, Apr 0.14, May 0.19, Jun 0.01, Jul 0.33, Aug 0.43, Sep 0.35, Oct 0.35, Nov 0.64, Dec 0.74 inches; annual average 4.77 inches.
September 6, 2026 event: Weather Underground Pioneertown station KCAPIONE185, elevation 4,311 ft. Recorded precipitation 0.44 inches; high 85°F; low 70°F; maximum wind 13 mph.